Start Profiling
![]() Updated 1 year ago
by
Kerry Poe
Updated 1 year ago
by
Kerry Poe
Start Profiling

Summary
Used to capture high-level performance statistics of EVOLVE features, which can help determine if further investigation is needed.
- eVolve tab ⮞ Resourcespanel ⮞ Start Profiling button

- eVolve tab ⮞ Resourcespanel ⮞ Stop Profiling button


Usage
IMPORTANT: It is recommended that the profiling session only be run to capture specific scenarios; long-running profiles can result in misleading reports. Once a profile session has started, it will run silently in the background to capture performance statistics.
To Start profiling
- From the eVolve ribbon, in the Resources panel, click Start Profiling.
- From the Start Profiling window, click Yes.
- Use the EVOLVE features and functions as you would typically use them.
- Once the tool has run long enough to see the performance degradation, stop the tool.

To Stop Profiling
- From the eVolve ribbon, in the Resources panel, click Stop Profiling.
WARNING: Canceling/closing the Save As window will result in losing all profiling data.
- From the Save As window,
- Navigate to a known location to save the data file.
- Enter a unique name in the File Name field.
- Click Save.
- The text file automatically opens.
- Send this file to EVOLVE support to evaluate the results and provide feedback - support@evolvemep.com

Data Breakdown
The data within the file is organized into groups under sections labeled "By X," with entries grouped by their corresponding "Name" values.
- There are two levels:
- Top Level - entries that have no parent. These can trigger other profile-able actions.
- Child - refers to actions resulting from a Top-Level action. They usually include Command and ExternalEvent types, though not all will have child records.
Additionally, there will be an Audit section for each level, which shows every action that occurred in the order they occurred. Audit columns include the following:
Audit values to note
- TOTAL - Total time spent (in milliseconds) within that respective action.
- This is calculated as EV ACTION + RVT SEL + OTHER = TOTAL
- COUNT - displays the number of commands performed.
- PS - (PowerShell) - Time spent executing PowerShell scripts.
- EV ACTION - (EVOLVE Action) - Only applicable for “Top Level” entries. Displays the aggregate Total value for all child entries
- RVT SEL - (Revit Selection) - Time spent waiting on a selection (when a user is prompted to select elements)
- OTHER - This is a catch-all - it captures the amount of time on non-tracked actions such as (but not limited to) the user typing data, a UI is open and idle, actions performed by EVOLVE which are not done within a progress bar, or other tracked EV Action.
- This is calculated as TOTAL - EV ACTION - RVT SEL = OTHER
- This is calculated as TOTAL - EV ACTION - RVT SEL = OTHER
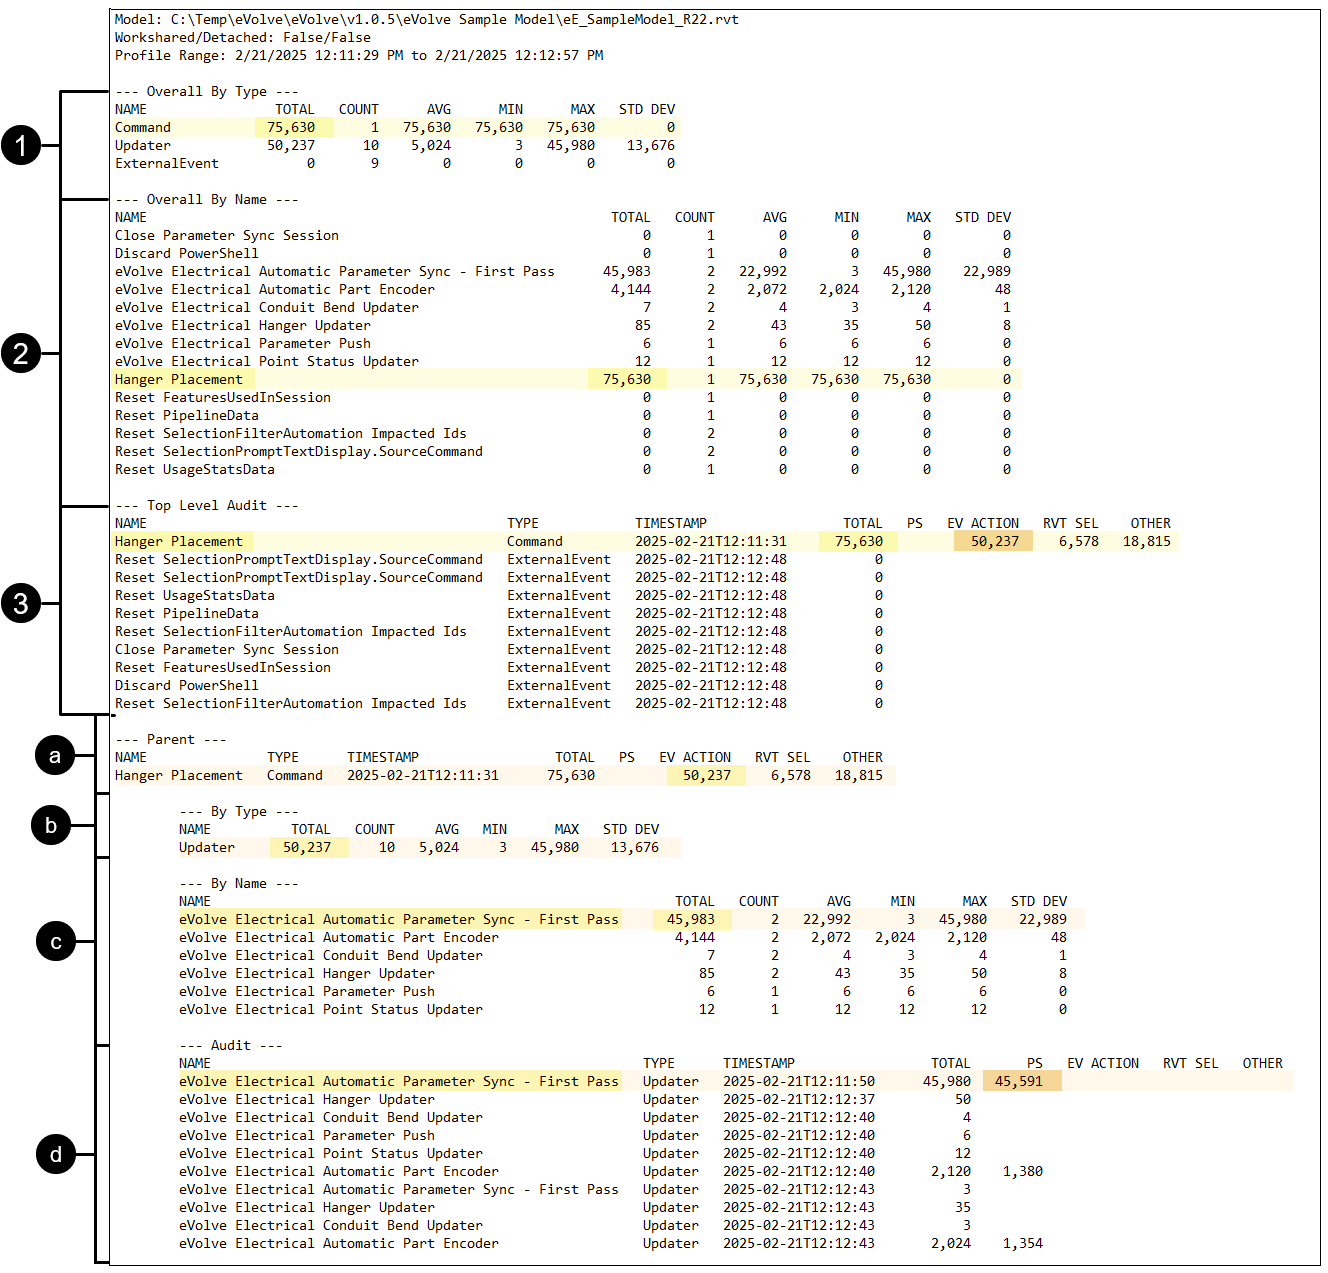
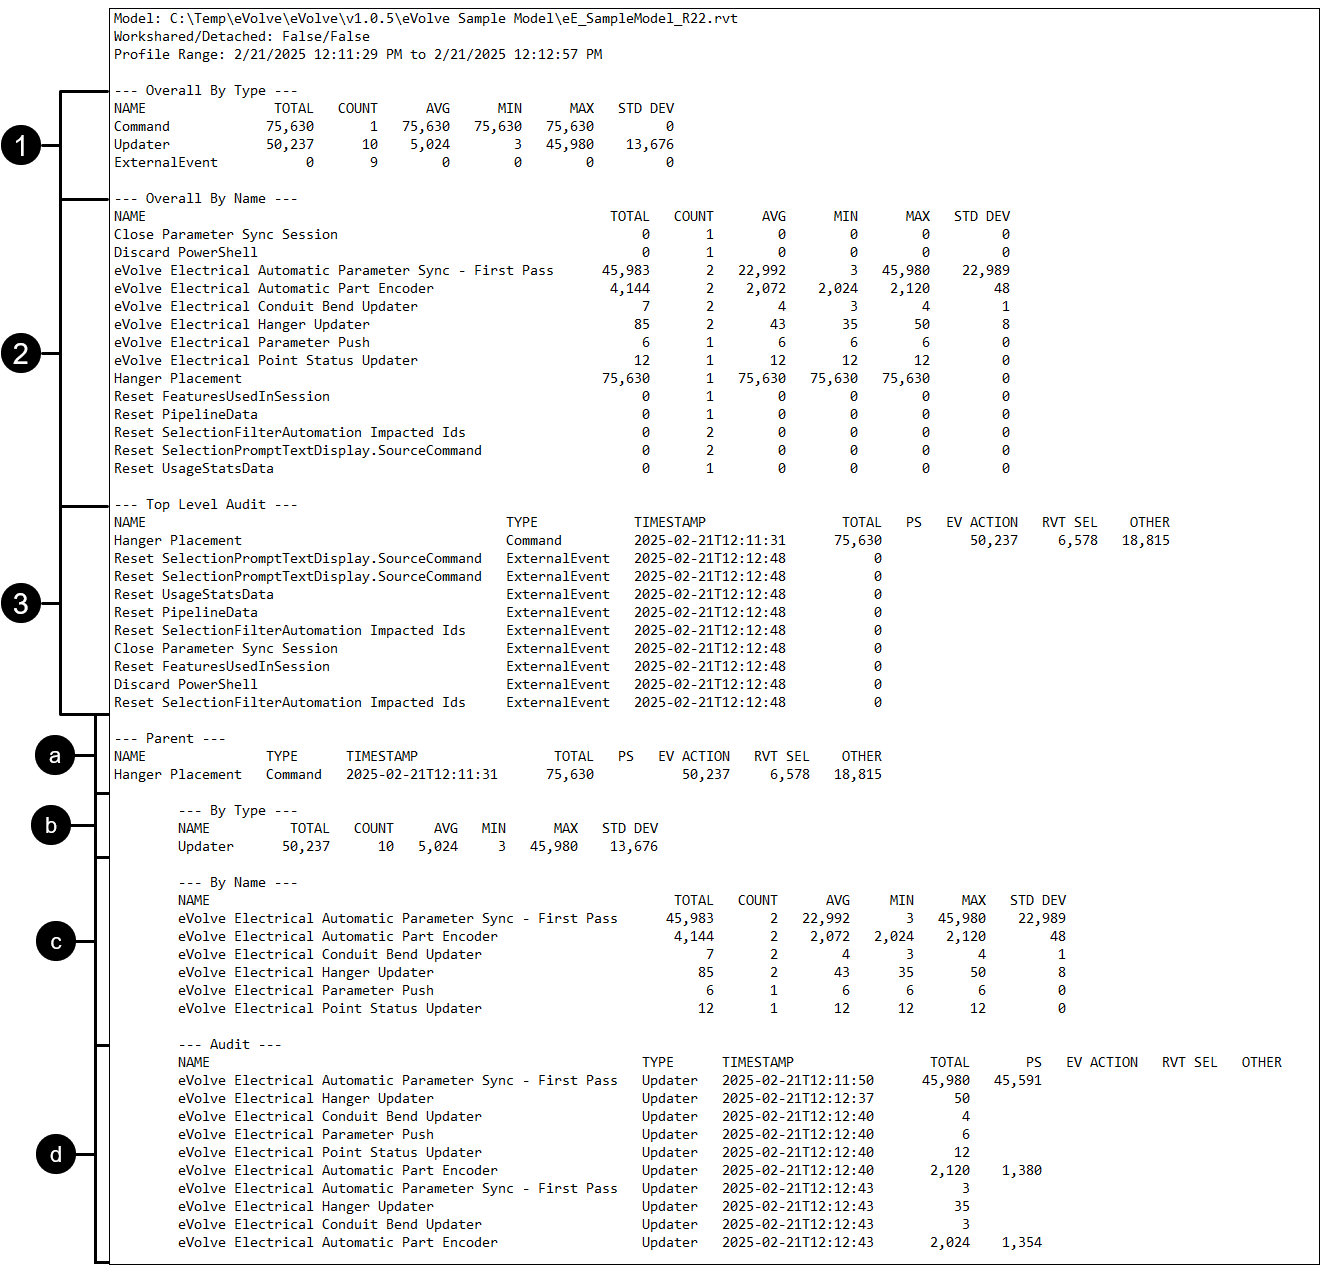
Top Level
- Top Level - Overall By Type - displays the number of recorded commands, updaters, and external events by type and the time it took to perform their functions.
- Top Level - Overall By Name - displays the number of recorded commands, updaters, and external events by name and the time it took to perform their functions.
- Top Level - Top Level Audit - displays the TOTAL, PS, EV ACTION, RVT SEL, and OTHER times each function took to perform their task.
- When evaluating the audit data, look to see if the EV ACTION's time is greater than the combined RVT SEL and OTHER times. If so, view the child Audit section to more details.- Child Level - Parent - displays the parent command name and the times it took to perform its function.
- Child Level - By Type - displays the child functions by type and the time it took to perform its function.
- Child Level - By Name - displays the child functions by name and the time it took to perform its function.
- Child Level - Audit - displays the TOTAL, PS, EV ACTION, RVT SEL, and OTHER times each child function took to perform their task.
Example
Let's use the sample above to determine what might be the issue if you are experiencing longer than expected processing times while placing hangers.
- When reviewing group #1 (Overall By Type), you see there's a Command that has taken 75 seconds (75,630 milliseconds) to run.
- When reviewing group #2 (Overall By Name), you see the command that took 75 seconds to run is named Hanger Placement.
- When reviewing group #3 (Top Level Audit), you see that 50 (50,237 milliseconds) of the 75 seconds is EVOLVE processing time(EV ACTION). This potentially indicates that EVOLVE is causing this performance issue.
We will apply the same logic to the Child Level as the Top Level.- When reviewing group A (Parent), you see the Hanger Placement command's TOTAL is 75 seconds, and of that, the EV ACTION took 50 seconds. This reflects the findings of the Top Level.
- When reviewing group B (By Type), you see there are ten Update functions that took 50 seconds to run.
- When reviewing group C (By Name), you see, of the ten functions, the eVolve Electrical Automatic Parameter Sync - First Pass function's TOTAL is 45 seconds.
- When reviewing group D (Audit), you see the PS (PowerShell script) took 45 seconds (45,591 milliseconds) to run.
This leads to the conclusion that the PowerShell script associated with the parameter sync rule is the cause for the increased processing time experienced when hangers are placed.