Report Manager

- Report Manager
Report Manager

Summary
The Report Manager allows users to create, modify, import, export, and print reports at a project level.
- eVolve tab ⮞ Utilities panel ⮞ Report Manager button


Prerequisites

Usage
Specifying a default report folder
Before creating a new report, a default report folder must be specified.
- From the Report Manager window, click the Browse button in the Default Folder for Reports panel.
- From the Default Folder for Reports window, browse to the desired folder and click OK. The selected folder appears in the Default Folder for Reports panel and a .repx file is created in the specified location.

Creating a report file
Before creating a report, a report file must be created.
- From the Report Manager window, click the Create New Report button.
- From the Create New Report window, select the primary Data Profile for the report from the menu and click OK.
- From the Create New Report window, in the File Name field, specify a name for the report file, and click Save. The Report Designer window opens.
Note: the default name is the same as the select primary profile if not changed.

Creating a report
- From the Report Manager window, in the grid, select a cell from the Click here to add a new row and specify the following:
Required
- Name
- Primary Profile
- Report File Path
Optional
- Group
- Sub Group
- Description
- Additional Profiles
- Prompt for Parameters
- Once the row is created and the required and if desired, the optional fields are specified, click Apply or OK.

Printing Reports
- From the Report Manager window, select the desired report(s) and click the Run Reports button.
NOTE: If multiple reports are selected, press the SHIFT key while closing a report to break the Run Report loop.
- From the Preview window, click the Print button.
TIP: clicking the Quick Print button sends one copy of the report to the default printer.
- From the Print window, select your desired printing preferences, like printer, number of copies, etc, then click the Print button.

Exporting Reports (Removed as of 6.2)
IMPORTANT: this feature was removed in v6.2; please use the Configuration Exchange feature to export reports.
The Export feature allows selected reports to be saved to a file.
NOTE: currently, when exporting reports any associated data profiles and/or data tables are not included and must be exported separately.

Import Reports
IMPORTANT: this feature was deprecated as of v6.2 and will be removed in a future release; please use the Configuration Exchange feature to import reports.
The Import feature allows exported reports to be saved to a project.
NOTE: currently, when importing reports any associated data profiles and/or data tables are not included and must be imported separately. As a best practice, if a report has additional components like a Data Table, import the additional components first.
- If applicable, from Utilities/Data Tables, import the associated data table.
- From Utilities/Data Profiles, click Import Profile.
- From the Import Profile window, navigate to the required profile(s) for the desired report and click Open.
NOTE: a report may contain multiple profiles, however, each profile must be imported separately.
- If the report contains multiple profiles, repeat step 3, until all required profiles have been imported.
- From Utilities/Report Manager, click Import.
- From the Import window, navigate to the exported Report file (.eVReport) and click Open.
IMPORTANT: Verify the Report File Path is pointing to the current/correct location of the .repx file.
- After the report has been imported, click Apply or OK.

Window Overview
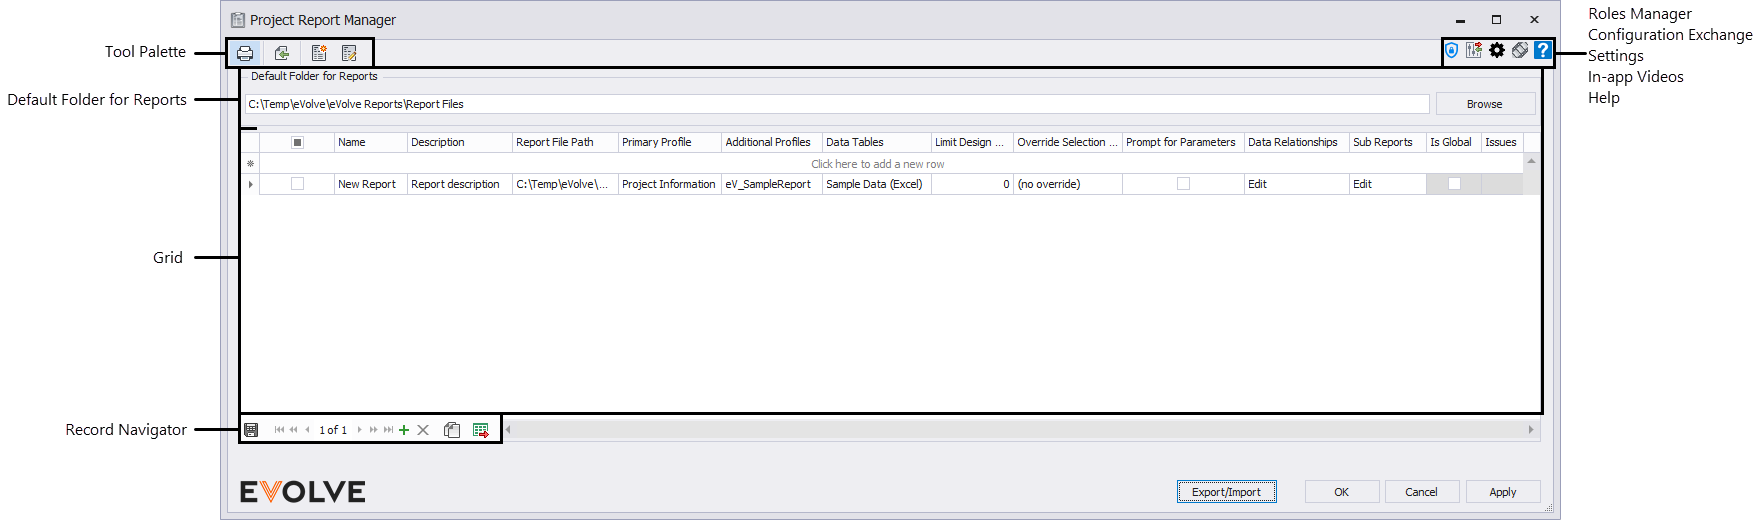
Tool Palette buttons
- Run Report - used to preview and print reports.
- Import (Deprecated as of v6.2) - used to import a report configuration file.
- Create New Report - used to generate a report file.
- Open Report Designer - used to layout/format a new report and/or modify an existing report.
- Role Manager - sends the current configuration to the Role Manager.
- Configuration Exchange - Used to import/export reports and their dependencies; please see the Configuration Exchange article for more information.
- In-app Videos - displays a video summary of the tool.
Grid Columns
- Name - used to apply a unique label to a report configuration.
- Group - used to assign a report configuration to a category/type.
- Sub Group - used to assign a report configuration to a subset of a group/category.
- Description - used to provide additional information about the report configuration.
- Primary Profile - defines the main collection of parameters used to create the report configuration.
- Additional Profiles - defines other collection(s) of parameters used to create the report configuration.
- Data Tables - defines Data Tables used to create the report configuration.
- Report File Path - defines the location of the .repx file.
- Limit Design Rows - when provided, limits the number of elements pulled from Revit when using the designer. In many scenarios this can improve load time when source queries result in a large number of elements. Provide 0 to ignore. Please see the Increasing load times when designing a report section below in Tips and Tricks for more information.
- Override Selection Scope - temporarily overrides the report's Data Profile(s) selection scope. To permanently change the selection scope, update the respective entry within Data Profiles.
- Entire Project - Runs the element filter against all elements in the model. Nested or contained elements (assemblies, groups, or nested families) are evaluated individually because they exist in the project, even if their container doesn’t pass.
- Active View - Runs the element filter against only elements visible in the current view. Nested or contained elements are still evaluated if they appear in the view.
- Current Selection - Runs the element filter only on elements currently selected in Revit. If a selected container (assembly, group, or family) fails the filter, its nested elements are not evaluated or expanded.
- See the Tips and Tricks section for more information.
NOTE: To permanently change selection scope, update the respective entry within Data Profiles.
- Prompt for Parameters - when checked, a report preview is not generated until the required parameters, if specified, are supplied.
- Data Relationships - used to define aliases and relationships between data sources.
- Sub Reports - displays the Mapping for Sub Reports window. See the Sub Reports article for more information.
- Is Global - Specifies if this entry is defined within a global configuration. If the Is Global checkbox is checked, then the entry is read-only.
Record Navigator buttons
- Add - used to add a new row to the grid.
- Delete - used to delete selected row(s).
- Duplicate - used to duplicate selected rows.
- Export Grid - exports the grid as currently displayed to Excel.
Setting
- Settings - opens Data Profiles.

Tips and Tricks
Designing reports
From the Report Manager window, in the grid, select the desired report and click Open Report Designer from the tool palette.
IMPORTANT: For more information on the Report Designer window, click the following link.

Selection Scope
The Selection Scope defines where the Element Filter looks for elements when a Data Profile runs. It controls whether the filter is applied to the entire model, a view, or only the elements currently selected.
Why Results Differ
Results may vary when using Current Selection instead of Entire Project or Active View because:
- With Entire Project and Active View, nested elements exist independently in the model or view and are evaluated directly.
- With Current Selection, only the selected container is checked; its nested elements are ignored unless the host passes the filter.
Interaction with Expansion Options
Expansion Options (Assemblies, Groups, Nested Elements) only apply when the container element is in scope. If Current Selection is used and the host fails the filter, its contained elements are not expanded or compared.
NOTE: Expansion Options are most effective with Current Selection, allowing contained elements within the selected object to be included. However, they can also be useful with Active View or Entire Project to ensure nested elements appear in model-wide or view-based reports — though this may increase processing time.
Customizing Reports

Revit Units
All parameter values sent from Data Profiles are string values regardless of the original type in Revit. From Data Profiles, users may elect to send the display value by checking the Use Display Value checkbox or the internal Revit value by leaving this option unchecked. However, this value is still a string and may pose issues when performing calculations within the report. To help alleviate this issue, a string may be converted to Revit values from the Expression Editor.
Each unit conversion has a "To_Display" and a "To_Value" option and is dependent on how the value is sent from Data Profiles. The To_Display converts the numeric internal Revit value string into the displayed measurement value honoring the project units set for the respective Revit project. The To_Value converts the formatted display value string into the numeric internal Revit value.
After a field is placed on the Design Surface, from the Expression Editor window, go to Functions and click Revit.

Optimizing Reports
Some reports may open and/or run slower than others, there are many causes like the number of fields in the Data Source, parameters running PowerShell scripts, size of the Revit project, etc. However, there are some good practices to keep in mind when initially creating the reports.
The Data Source(Data Profile)
- Only send relevant data. Remove irrelevant categories and parameters from the Data Profile.
- Are PowerShell scripts running? Keep in mind, that each PowerShell script is running on every element that meets the criteria defined in the data profile's element filter. If the report is taking a long time to open, consider splitting up the profile and including the parameters with PowerShell scripts in an additional profile.

Increasing load times when designing a report
When designing a report, dealing with model/project load times can be frustrating, especially when 99% of the time, a smaller subset of the data will do. You can do a couple of things to increase the load times. Within the report's Data Profile, if the Selection Scope is set to Entire Project, change it to Active View, Current Selection, or Prompt on Execution. Now, the report will only display the selected elements or the elements in the current active view. Please keep in mind that if the report's Data Profile is used for multiple features (which is NOT recommended for reports), changing the Selection Scope may have some unintended consequences.
The Limit Design Rows feature is intended to decrease the load time by allowing users to limit the number of rows loaded in the designer and does not affect the number of rows returned from the Preview window. However, this will only yield a performance gain when the respective Element Filter results in a “fast” query - that is, one where the query can be resolved entirely using Revit. An easy way to spot a “slow” query (where this will not be applicable) is when one of the following (non-comprehensive!) settings is used:
- An “is blank” or “is not blank” condition is present
- An Or condition is present
- “Use Internal Filtering” is enabled
- PowerShell is used for filtering
NOTE: When limiting a report's design records and opening the report, a warning is displayed so you can verify the current limits and make any necessary adjustments if needed.
Enabling the Limit Design Rows feature
- From the Report Manager window, right-click on a column header and click Column Chooser.
- From the Customization window, drag and drop Limit Design Rows to the grid's header area. The Limit Design Rows column is added to the grid.
- The default value of 0 is applied to all reports; this signifies that the reports are not constrained and all rows will be returned. To limit the number of rows returned, enter a value in the desired report's Limit Design Rows cell and click Apply.
